
Multi-Factor Value: Why One Metric Is Not Enough

Dr. Simon Lichte
Published on
Almost every discussion about cheap stocks starts with the price-to-earnings ratio. That makes sense, because the P/E is quick to calculate and available everywhere. It has just one flaw: it rests on a single figure from the income statement, and that figure can be influenced in plenty of perfectly legal ways. One company sells a property and its profit jumps. Another writes down an acquisition and its profit collapses, even though the operating business is running exactly as before. Look only at the P/E and in both cases you are seeing something that has little to do with the actual state of the company.
The Multi-Factor Value screener, known in the financial literature as the Value Composite, draws a simple conclusion from this. It asks the same question four times, from four different directions.
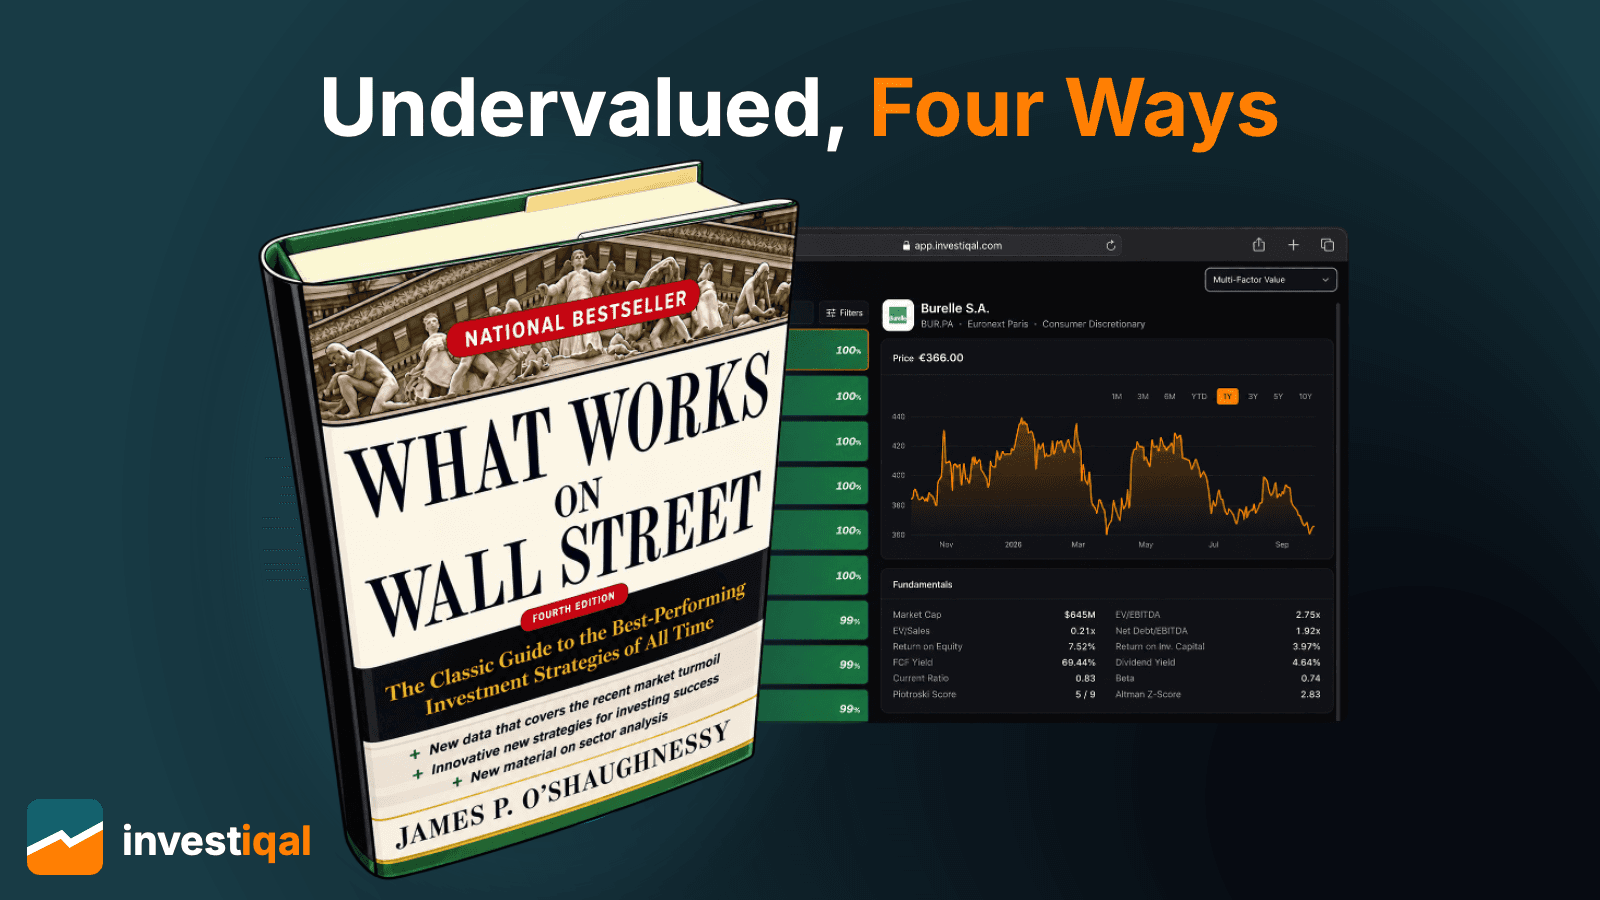
The investor who made this idea widely known is the American James O'Shaughnessy. In his book What Works on Wall Street, he spent decades examining which valuation metrics have historically been worth anything. One of his central findings: a bundle of several value metrics produces more reliable results than any single metric on its own, because the weaknesses of the individual metrics offset each other. Our screener is inspired by that approach. It is not a one-to-one reproduction of his formula, but uses four factors that can be calculated cleanly and verifiably from the company data available to us.
One Question, Four Angles
Every one of those questions has the same intent: how much company am I getting for the price I have to pay? The difference lies in what "how much company" is measured against. Profit is one option. But a company is also worth something because it generates cash, because it owns assets, and because it makes sales. Each of these four measures has its own weakness, and those weaknesses sit in different places. That is the whole trick: where one metric is blind, another one is looking.
The Four Factors
Earnings yield: operating profit (EBIT) divided by enterprise value. Enterprise value is not the stock market value of the shares, but the realistic price for the whole firm including its debt. This metric makes a debt-free company and a heavily indebted one comparable, which the classic P/E does not. We explained it in more detail in our article on the Magic Formula.
Free-cash-flow yield: free cash flow divided by market capitalisation. Free cash flow is the money left over after the company has paid for its ongoing operations and invested in its assets. It is the most honest of the four measures, because cash flow leaves considerably less room for judgement than reported profit. A company can shape its profit through accounting decisions. Money in the bank is either there or it is not.
Book-to-market: balance sheet equity divided by market capitalisation. You probably know this as the price-to-book ratio, only the other way round. This metric asks about substance rather than earnings: what does the company own once all debt is subtracted, and what does it cost on the stock market? It helps in particular with companies whose profits are currently swinging around but whose assets stay stable.
Sales to enterprise value: annual revenue divided by enterprise value, in other words the inverted price-to-sales ratio. Revenue is the most stable of the four measures. It rarely collapses in a weak year the way profit does. That is why this factor still shows the scale of the business even when the earnings metrics are temporarily distorted. Revenue alone says nothing about quality, but it does say something about how much business you are getting for your money.
Why Four Factors Are More Than Four Opinions
The effect becomes clear in a simple case. A company sold off a stake last year. Its profit is exceptionally high as a result, its earnings yield looks outstanding, and the share seems dirt cheap. That one-off effect does not show up in the same form in free cash flow, and not at all in revenue. So the company will shine on one factor and stay unremarkable on the other three. In the overall result it lands mid-table, which is exactly where it belongs.
The same holds in reverse. A company that sits in the upper range on all four factors is very probably genuinely cheap, rather than merely calculated as cheap by an accounting effect. That agreement across four independent angles is the real signal of the strategy.
How the Ranking Is Built
The calculation is deliberately unspectacular:
- All companies are sorted by earnings yield. The best one takes position 1.
- The same happens for free-cash-flow yield.
- The same for book-to-market.
- The same for sales to enterprise value.
- The four positions are added together. The lowest sum wins.
All four factors count equally. That is a deliberate decision, not convenience. You could try to give free cash flow more weight than revenue, on the grounds that it is the more robust measure. But that assumes you know which factor will work better in the years ahead. That assumption would be a forecast, and forecasts are precisely what a rule-based strategy is trying to avoid. Equal weighting means we do not presume to make that prediction.
Equal weighting has a second effect as well. A top placement on one factor buys an advantage of a few rank positions, no more. Outliers cannot hijack the list.
The Important Difference From the Magic Formula
Both strategies use the same ranking procedure, but they ask different things. Greenblatt's Magic Formula combines price and quality. It requires a company to be cheap and to use its capital efficiently. Multi-Factor Value asks about price alone, but more thoroughly. It measures no return on capital, no growth, no balance sheet risk and no management quality.
That is not a weakness, it is a different job. Multi-Factor Value answers the question "which companies are most cheaply valued relative to their fundamentals?" as cleanly as possible. Whether such a company also runs a good business is a second question, and one you have to ask yourself.
From that follows the most important caveat about this strategy: a low valuation is not automatically an opportunity. It can also be an accurate assessment by the market. Cheap companies can stay cheap or get cheaper, because the market has spotted a problem that appears in none of the four metrics.
Who Does Not Get Ranked
Two groups of companies do not appear in the list.
First: banks, insurers and utilities. Their balance sheets are structurally different, which means metrics such as book-to-market mean something else for them than they do for an industrial company. These sectors are excluded by default in order to preserve comparability.
Second: every company where one of the four metrics cannot be calculated cleanly, for instance in cases of negative profit, negative free cash flow, negative equity or missing balance sheet data. We would rather a company be missing from the ranking than have it appear on a metric that does not hold up.
How to Use the Screener in Investiqal
In the Screening section, you select the Multi-Factor Value strategy at the top and get the finished ranking across the entire stock universe we cover.
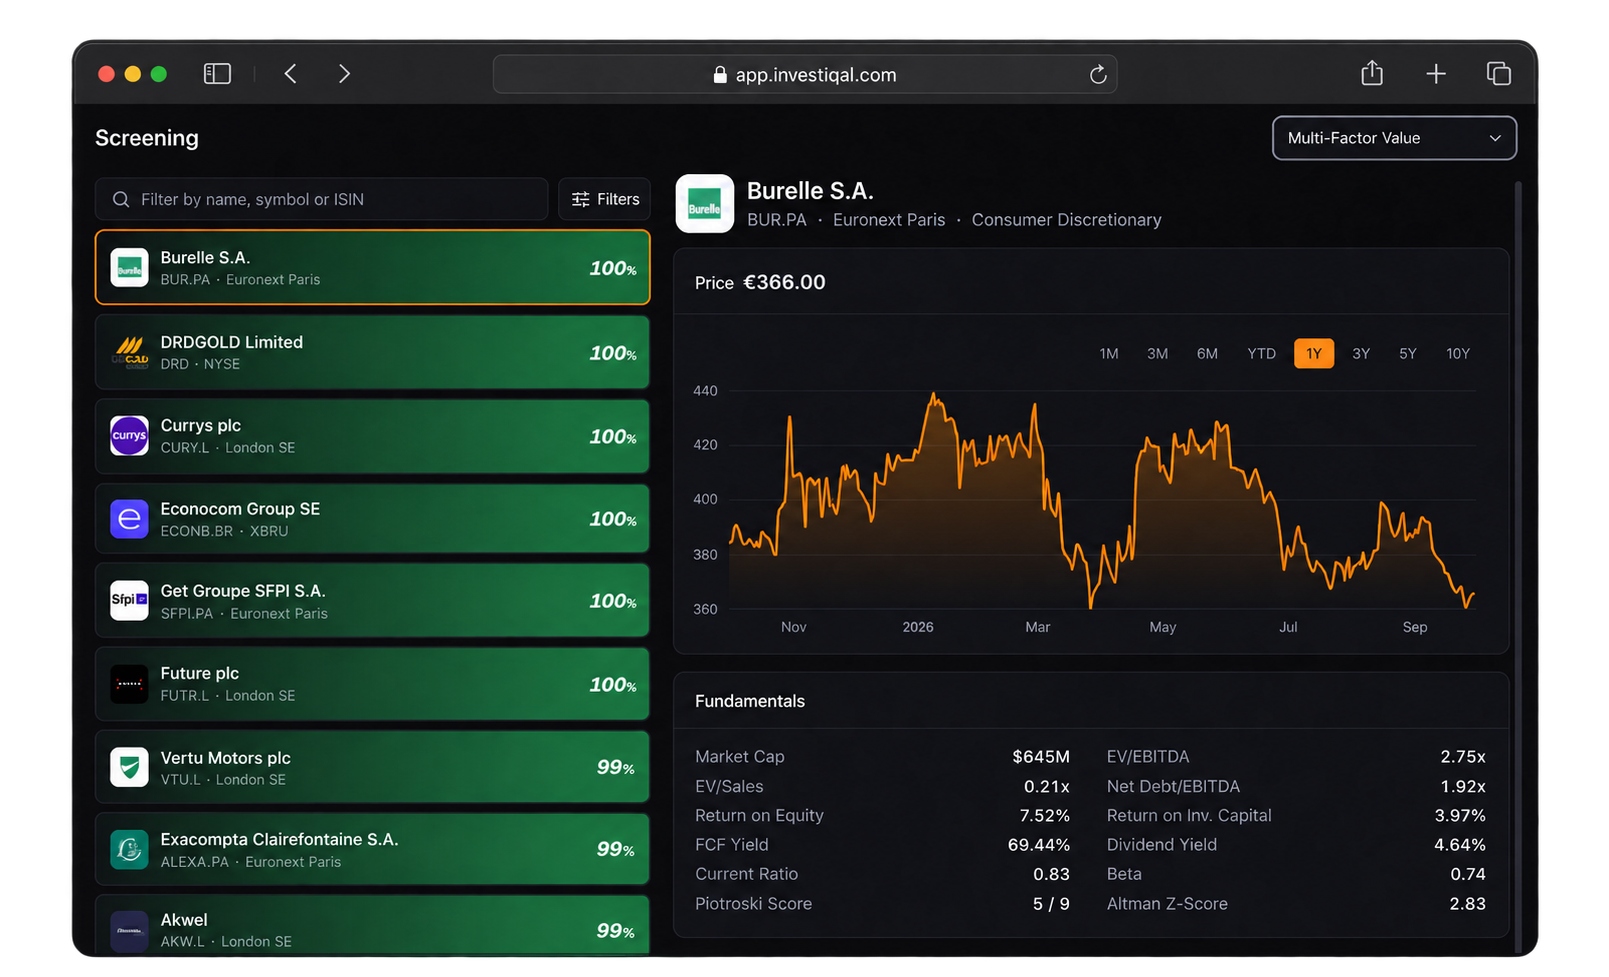
The percentage next to each company is its rank position translated onto a scale. 100 percent stands for the best placed company in that run, 0 percent for the last. A value of 96 percent therefore means that, across all four valuation factors, this company is among the best four percent of all the companies examined. The value is relative, because a ranking compares the candidates with each other and not against a fixed benchmark.
One tip especially for this strategy: take a look at the minimum market cap in the expert settings. Value rankings attract very small companies, because their metrics fluctuate more and therefore make them look extremely cheap very quickly. A floor of 150 million US dollars has proven itself in practice and filters out a large share of these cases.
What You Do With It
The Multi-Factor Value screener turns several thousand listed companies into a manageable list that follows a clear logic you can check at any time. It tells you where a closer look is worthwhile. It does not tell you what to buy.
The interesting work begins after that: understanding why the market values a company so low. Sometimes the answer is that the market is not paying attention. Sometimes it is that the market is paying very close attention indeed. Telling those two apart is the part no formula takes off your hands, and buying you the time for it is exactly what Investiqal is for.
This article explains how one analysis method works. It is neither investment advice nor an investment recommendation. Investing carries risk, up to and including the total loss of the capital you put in. Investment decisions are yours alone to make.
Ready to try Investiqal?
Sign Up