
The Magic Formula: How the Greenblatt Screener Works

Dr. Simon Lichte
Published on
When you first look into picking stocks, the sheer number of metrics is overwhelming. P/E ratio, EBIT, book value, equity ratio, free cash flow: every metric tells you something, but none of them tells you on its own whether a company is a good investment. Twenty years ago, the American fund manager Joel Greenblatt made a proposal that starts exactly here. In his book The Little Book That Beats the Market, he boils the question down to two essential points; he calls the result the Magic Formula. The name sounds more sensational than the idea behind it, because there is nothing magic about it. His approach is a very consistent way of asking, and answering, two extremely sensible questions.
Two Essential Questions Instead of a Dozen Metrics
Imagine you are not buying a share, but a bakery in your town. You would probably want to know two things. First: how much profit does this bakery make in a year, measured against the price you are being asked to pay for it? Second: how good is the business itself, meaning how much profit does the bakery generate from the capital tied up in its ovens, its shop fittings and its supplies?
The first question is the question of price. The second is the question of quality. These are exactly the two questions Greenblatt puts to every listed company. A share can be cheap because the business behind it is weak, and an excellent company can be so expensive that buying in no longer pays off. Only both questions together give you a usable picture.
Question 1: What Do I Get for My Price?
The metric for this is the earnings yield. It sets a company's operating profit against what the entire company costs on the market:
earnings yield = operating profit (EBIT) / enterprise value
Two terms are worth knowing here.
EBIT is earnings before interest and taxes. This intermediate figure is used deliberately, because it shows what the business itself earns, regardless of how the company is financed and which country it pays taxes in. That makes two firms comparable even when one is debt free and the other runs on credit.
Enterprise value is the realistic price for the whole company. It is not simply the market value of all its shares. It adds the debt on top and subtracts the cash the company holds. Using our bakery as an example: if the seller is asking 500,000 euros but the bakery still carries 200,000 euros in bank loans, it actually costs you 700,000 euros. If, on the other hand, there are 50,000 euros in the business account that you acquire along with it, your effective price drops accordingly.
The higher the earnings yield, the more operating profit you get for your money. An earnings yield of 12 percent means, put simply: for every euro invested, the business generates twelve cents of operating profit per year.
Question 2: How Good Is the Business?
The second metric is return on capital. It measures how efficiently a company turns the capital it employs into profit:
return on capital = operating profit (EBIT) / invested capital
Invested capital is, roughly speaking, what is genuinely tied up in running the business: machinery, buildings and equipment, plus the money sitting in inventories and unpaid customer invoices, minus the payment terms suppliers grant.
An example makes the difference clear. Two companies both make 100 million euros in operating profit. One needs 200 million in capital to do it, the other needs 1,000 million. The first earns a 50 percent return on capital, the second 10 percent. For Greenblatt, the first is the far better business, and for a concrete reason: if it wants to grow, it has to put in far less additional capital for every extra euro of profit. High returns on capital are also a sign that a company has something competitors cannot easily copy, be it a brand, a patent or a particular position in its market.
Why Only the Combination Makes the Difference
Anyone who looks only at the earnings yield regularly ends up with companies that are cheap for good reason: shrinking markets, outdated technology, structural problems. The technical term for them is value traps. Anyone who looks only at return on capital, by contrast, ends up with the well known quality companies, which are often already valued so highly that the next few years of success are long since priced in.
Greenblatt's answer is so simple that it comes back around to elegant: demand both at once. What you are looking for is neither the cheapest nor the best company, but the company with the best combination of the two.
The Ranking: Adding Instead of Weighting
You could now try to force both metrics into a single formula and weight them against each other. Greenblatt does something different, and that is the real trick of his approach. He does not work with the numbers themselves, but with rank positions.
The procedure has three steps:
- All companies are sorted by earnings yield. The company with the highest earnings yield takes position 1.
- The same companies are sorted by return on capital. Again, the best one takes position 1.
- Both positions are simply added together. The lowest sum wins.
An example with three fictional companies. Alpha Tools comes second on earnings yield and first on return on capital, for a sum of 3. Hartley Retail comes first on earnings yield but only third on return on capital, for a sum of 4. Bradbury Systems comes third and second, for a sum of 5. So the ranking reads Alpha, Hartley, Bradbury.
Hartley Retail is the cheapest share of the three and still does not come out on top, because the business behind it is weaker. That is precisely the intention.
This way of calculating has an underrated advantage. It is robust against outliers. A single company with an absurdly high earnings yield, perhaps because a one-off effect inflated its profit, cannot dominate the ranking. It takes position 1 and with it exactly one point of advantage, no more.
What the Formula Deliberately Leaves Out
A sound approach also shows its quality by knowing its limits. There are two things Greenblatt's formula leaves out on purpose.
First: certain industries. Banks, insurers and utilities work with a fundamentally different balance sheet structure. For a bank, loans and deposits are the business itself, not working capital in the usual sense. A return on capital that is meaningful for a machinery manufacturer simply means something else for a bank. That is why these sectors are excluded by default. It is a deliberate decision in favour of comparability, not a judgement about those companies.
Second: the future. The formula assesses only what a company earns today and what it costs today. It contains no forecast, no assessment of management and no industry outlook. That is its weakness and its strength at the same time, because it protects you from mistaking stories about the future for facts.
How the Greenblatt Screener Works in Investiqal
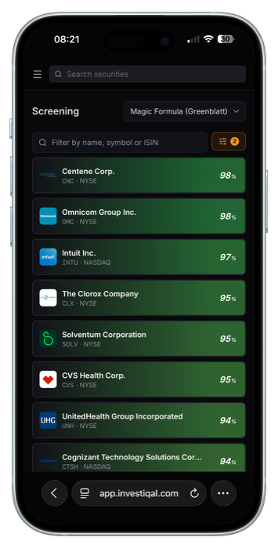 Investiqal does exactly this calculation for you. In the Screening section, you pick the Magic Formula (Greenblatt) strategy at the top, and you get the finished ranking for the entire stock universe we cover, sorted by the combined rank.
The percentage next to each company is that rank position translated into a score. 100 percent stands for the best placed company in that particular run, 0 percent for the last. A value of 98 percent therefore means: on the combination of valuation and return on capital, this company is among the best two percent of all the companies examined. The value is deliberately relative, because a ranking compares the candidates with each other and not against an absolute benchmark.
Companies where the calculation does not add up cleanly do not take part in the ranking. That covers cases such as negative operating profit, missing balance sheet data or excluded sectors. We would rather a company be missing from the list than have it show up on a metric that does not hold up.
What the Screener Does and What It Does Not
Greenblatt described his approach for long holding periods and broadly diversified portfolios, not for individual bets. The reason is simple: a ranking says something about the average of many companies, not about the fate of a single one. Individual names from the list can perform badly without that disproving the method.
The screener gives you a pre-selection you can follow and check. Several thousand listed companies become a manageable list that follows a clear logic you can verify at any time. What comes after that remains your job: taking a closer look at the remaining candidates, understanding how they earn their money, and deciding whether they suit your investment horizon and your appetite for risk.
That is exactly what Investiqal is built for. We take the number crunching and the data gathering off your hands, so you can spend your time on the questions a formula cannot answer.
This article explains how one analysis method works. It is neither investment advice nor an investment recommendation. Investing carries risk, up to and including the total loss of the capital you put in. Investment decisions are yours alone to make.
Ready to try Investiqal?
Sign Up